设置ECharts的全局坐标轴指示器
axisPointer
这是坐标轴指示器(axisPointer)在 ECharts 的全局公用设置。
坐标轴指示器的作用是指示坐标轴当前刻度的,它被广泛的作为一个实用的工具来使用。
在下面的实例中,当鼠标悬浮到图上的时候,您可以看到出现的标线和刻度文本:

上例中,使用了 axisPointer.link 来关联不同的坐标系中的 axisPointer。
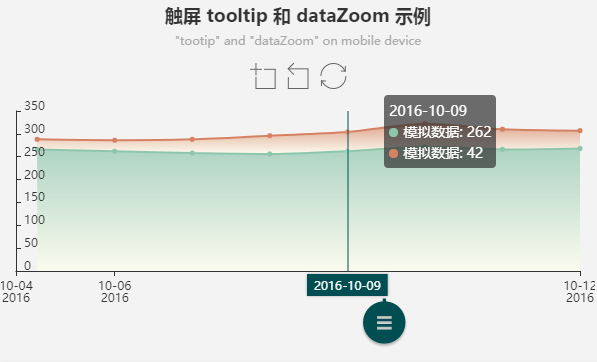
坐标轴指示器也有适合触屏的交互方式,如下:
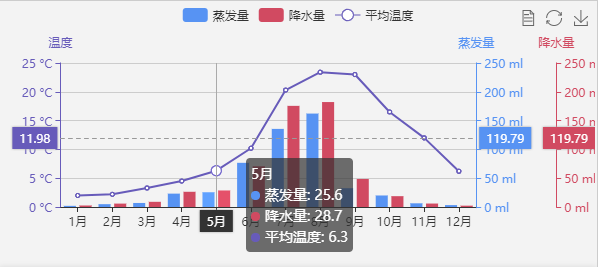
坐标轴指示器在多轴的场景能起到辅助作用:
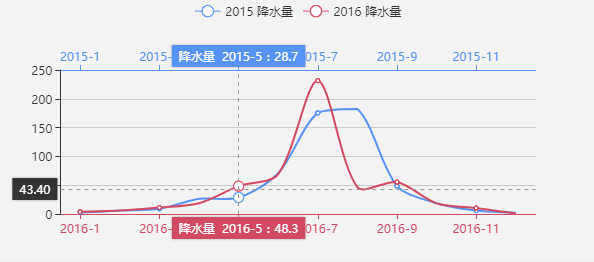
注意: 一般来说,axisPointer 的具体配置项会配置在各个轴中(如 xAxis.axisPointer)或者 tooltip 中(如 tooltip.axisPointer)。但是这几个选项只能配置在全局的 axisPointer 中:axisPointer.triggerOn、axisPointer.link。
如何显示 axisPointer:
直角坐标系 grid、极坐标系 polar、单轴坐标系 single 中的每个轴都自己的 axisPointer。
他们的 axisPointer 默认不显示。有两种方法可以让他们显示:
- 设置轴上的 axisPointer.show(例如 xAxis.axisPointer.show)为 true,则显示此轴的 axisPointer。
- 设置 tooltip.trigger 设置为 'axis' 或者 tooltip.axisPointer.type 设置为 'cross',则此时坐标系会自动选择显示哪个轴的 axisPointer,也可以使用 tooltip.axisPointer.axis 改变这种选择。注意,轴上如果设置了 axisPointer,会覆盖此设置。
如何显示 axisPointer 的 label:
axisPointer 的 label 默认不显示(也就是默认只显示指示线),除非:
- 设置轴上的 axisPointer.label.show(例如 xAxis.axisPointer.label.show)为 true,则显示此轴的 axisPointer 的 label。
- 设置 tooltip.axisPointer.type 为 'cross' 时会自动显示 axisPointer 的 label。
ECharts 关于触屏的 axisPointer 的设置:
设置轴上的 axisPointer.handle.show(例如 xAxis.axisPointer.handle.show 为 true 则会显示出此 axisPointer 的拖拽按钮。(polar 坐标系暂不支持此功能)。
注意: 如果发现此时 tooltip 效果不良好,可设置 tooltip.triggerOn 为 'none'(于是效果为:手指按住按钮则显示 tooltip,松开按钮则隐藏 tooltip),或者 tooltip.alwaysShowContent 为 true(效果为 tooltip 一直显示)。
详细的例子参考。
全局坐标轴指示器如何自动吸附到数据(snap):
在 ECharts 图表中的数值轴、时间轴如果开启了 snap,则 axisPointer 会自动吸附到最近的点上。

 免费 AI IDE



更多建议: