
Example: SVM: Maximum margin separating hyperplane
SVM: Maximum margin separating hyperplane
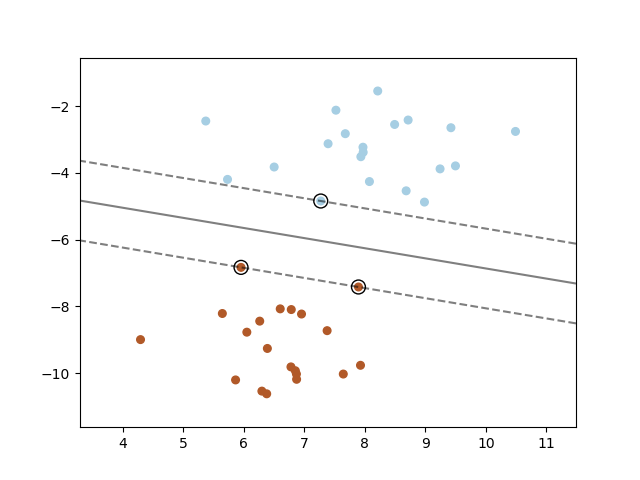
Plot the maximum margin separating hyperplane within a two-class separable dataset using a Support Vector Machine classifier with linear kernel.
print(__doc__) import numpy as np import matplotlib.pyplot as plt from sklearn import svm # we create 40 separable points np.random.seed(0) X = np.r_[np.random.randn(20, 2) - [2, 2], np.random.randn(20, 2) + [2, 2]] Y = [0] * 20 + [1] * 20 # fit the model clf = svm.SVC(kernel='linear') clf.fit(X, Y) # get the separating hyperplane w = clf.coef_[0] a = -w[0] / w[1] xx = np.linspace(-5, 5) yy = a * xx - (clf.intercept_[0]) / w[1] # plot the parallel