
Example: Density Estimation for a Gaussian mixture
Density Estimation for a Gaussian mixture
Plot the density estimation of a mixture of two Gaussians. Data is generated from two Gaussians with different centers and covariance matrices.
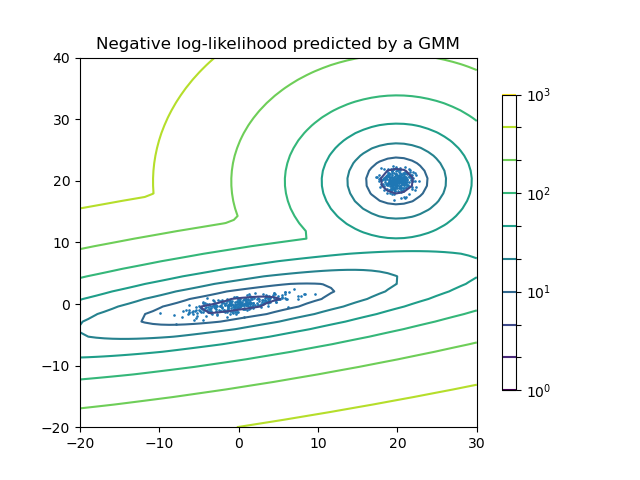
import numpy as np import matplotlib.pyplot as plt from matplotlib.colors import LogNorm from sklearn import mixture n_samples = 300 # generate random sample, two components np.random.seed(0) # generate spherical data centered on (20, 20) shifted_gaussian = np.random.randn(n_samples, 2) + np.array([20, 20]) # generate zero centered stretched Gaussian data C = np.array([[0., -0.7], [3.5, .7]]) stretched_gaussian = np.dot(np.random.randn(n_samples, 2), C) # concatenate the two datasets