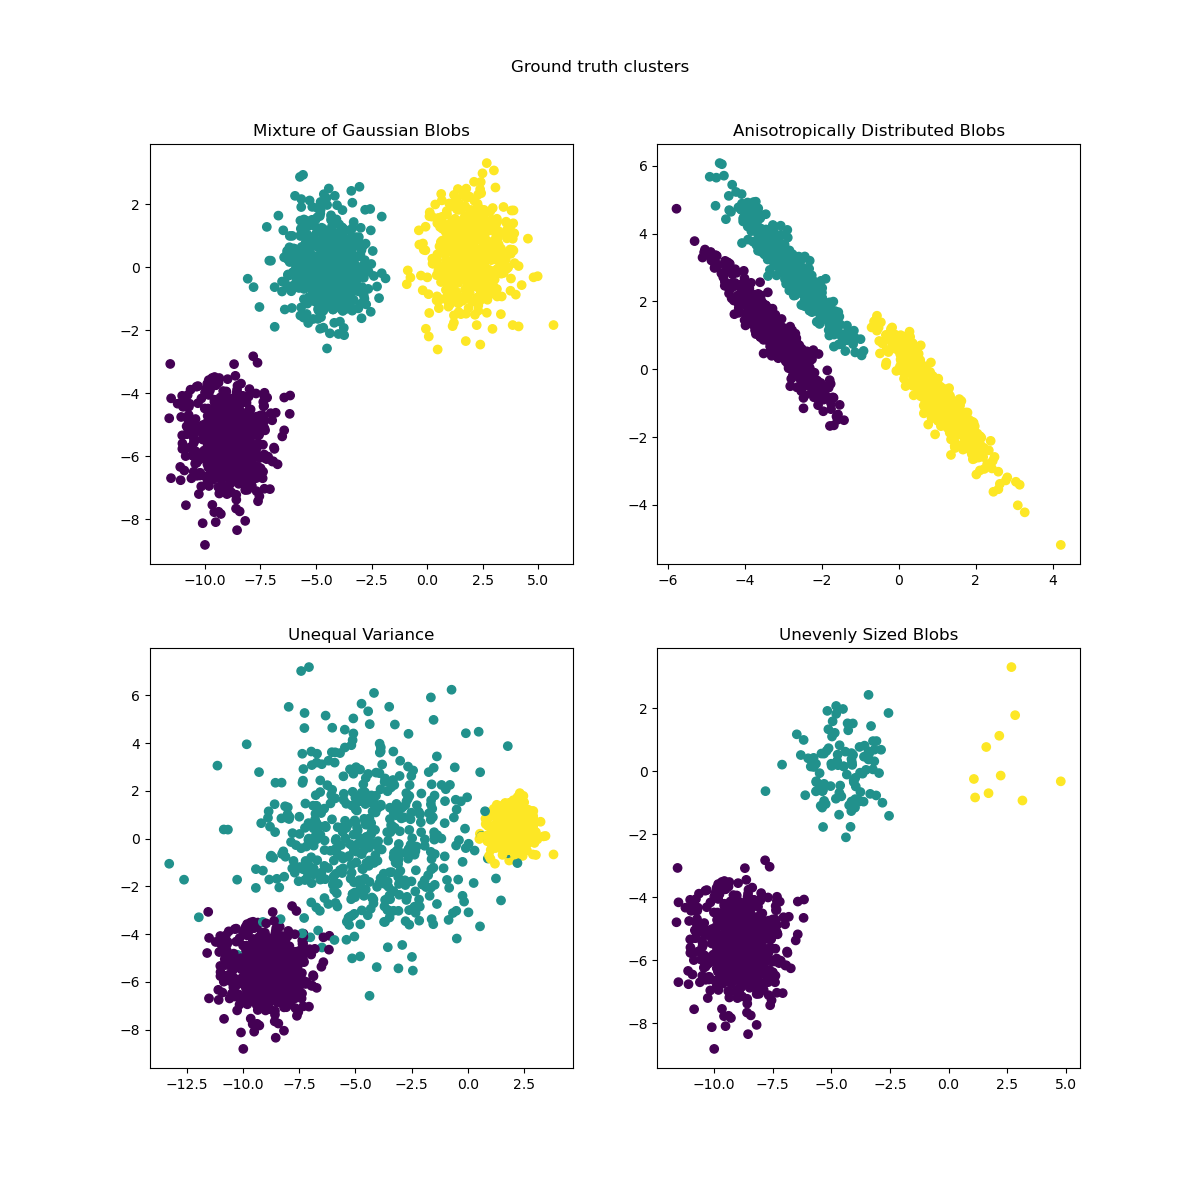
Example: Demonstration of k-means assumptions
Demonstration of k-means assumptions
This example is meant to illustrate situations where k-means will produce unintuitive and possibly unexpected clusters. In the first three plots, the input data does not conform to some implicit assumption that k-means makes and undesirable clusters are produced as a result. In the last plot, k-means returns intuitive clusters despite unevenly sized blobs.

print(__doc__) # Author: Phil Roth <mr.phil.roth@gmail.com> # License: BSD 3 clause import numpy as np import matplotlib.pyplot as plt from sklearn.cluster import KMeans from sklearn.datasets import make_blobs plt.figure(figsize=(12, 12)) n_samp
